
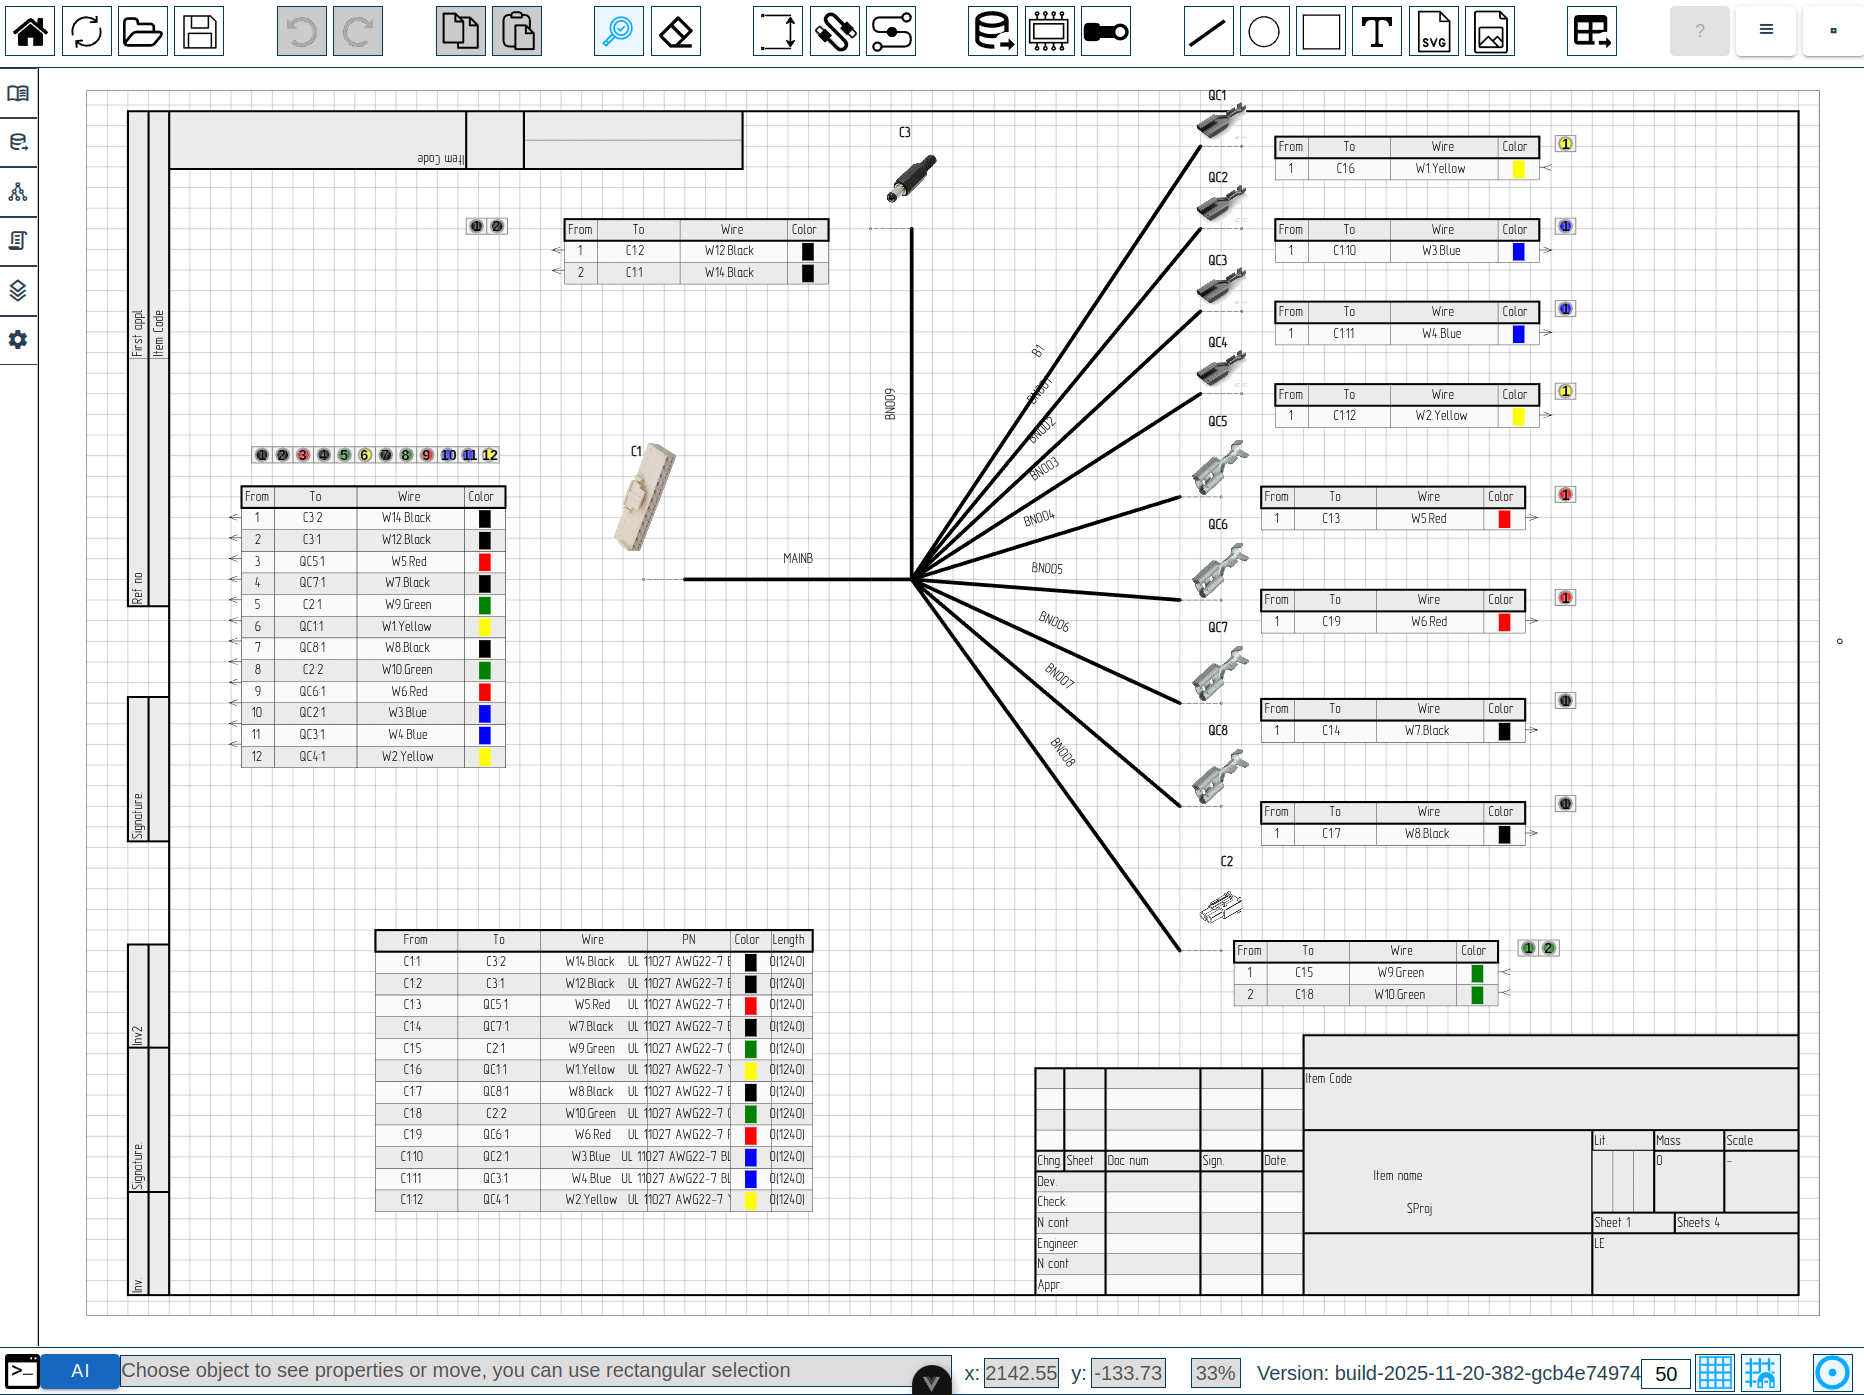
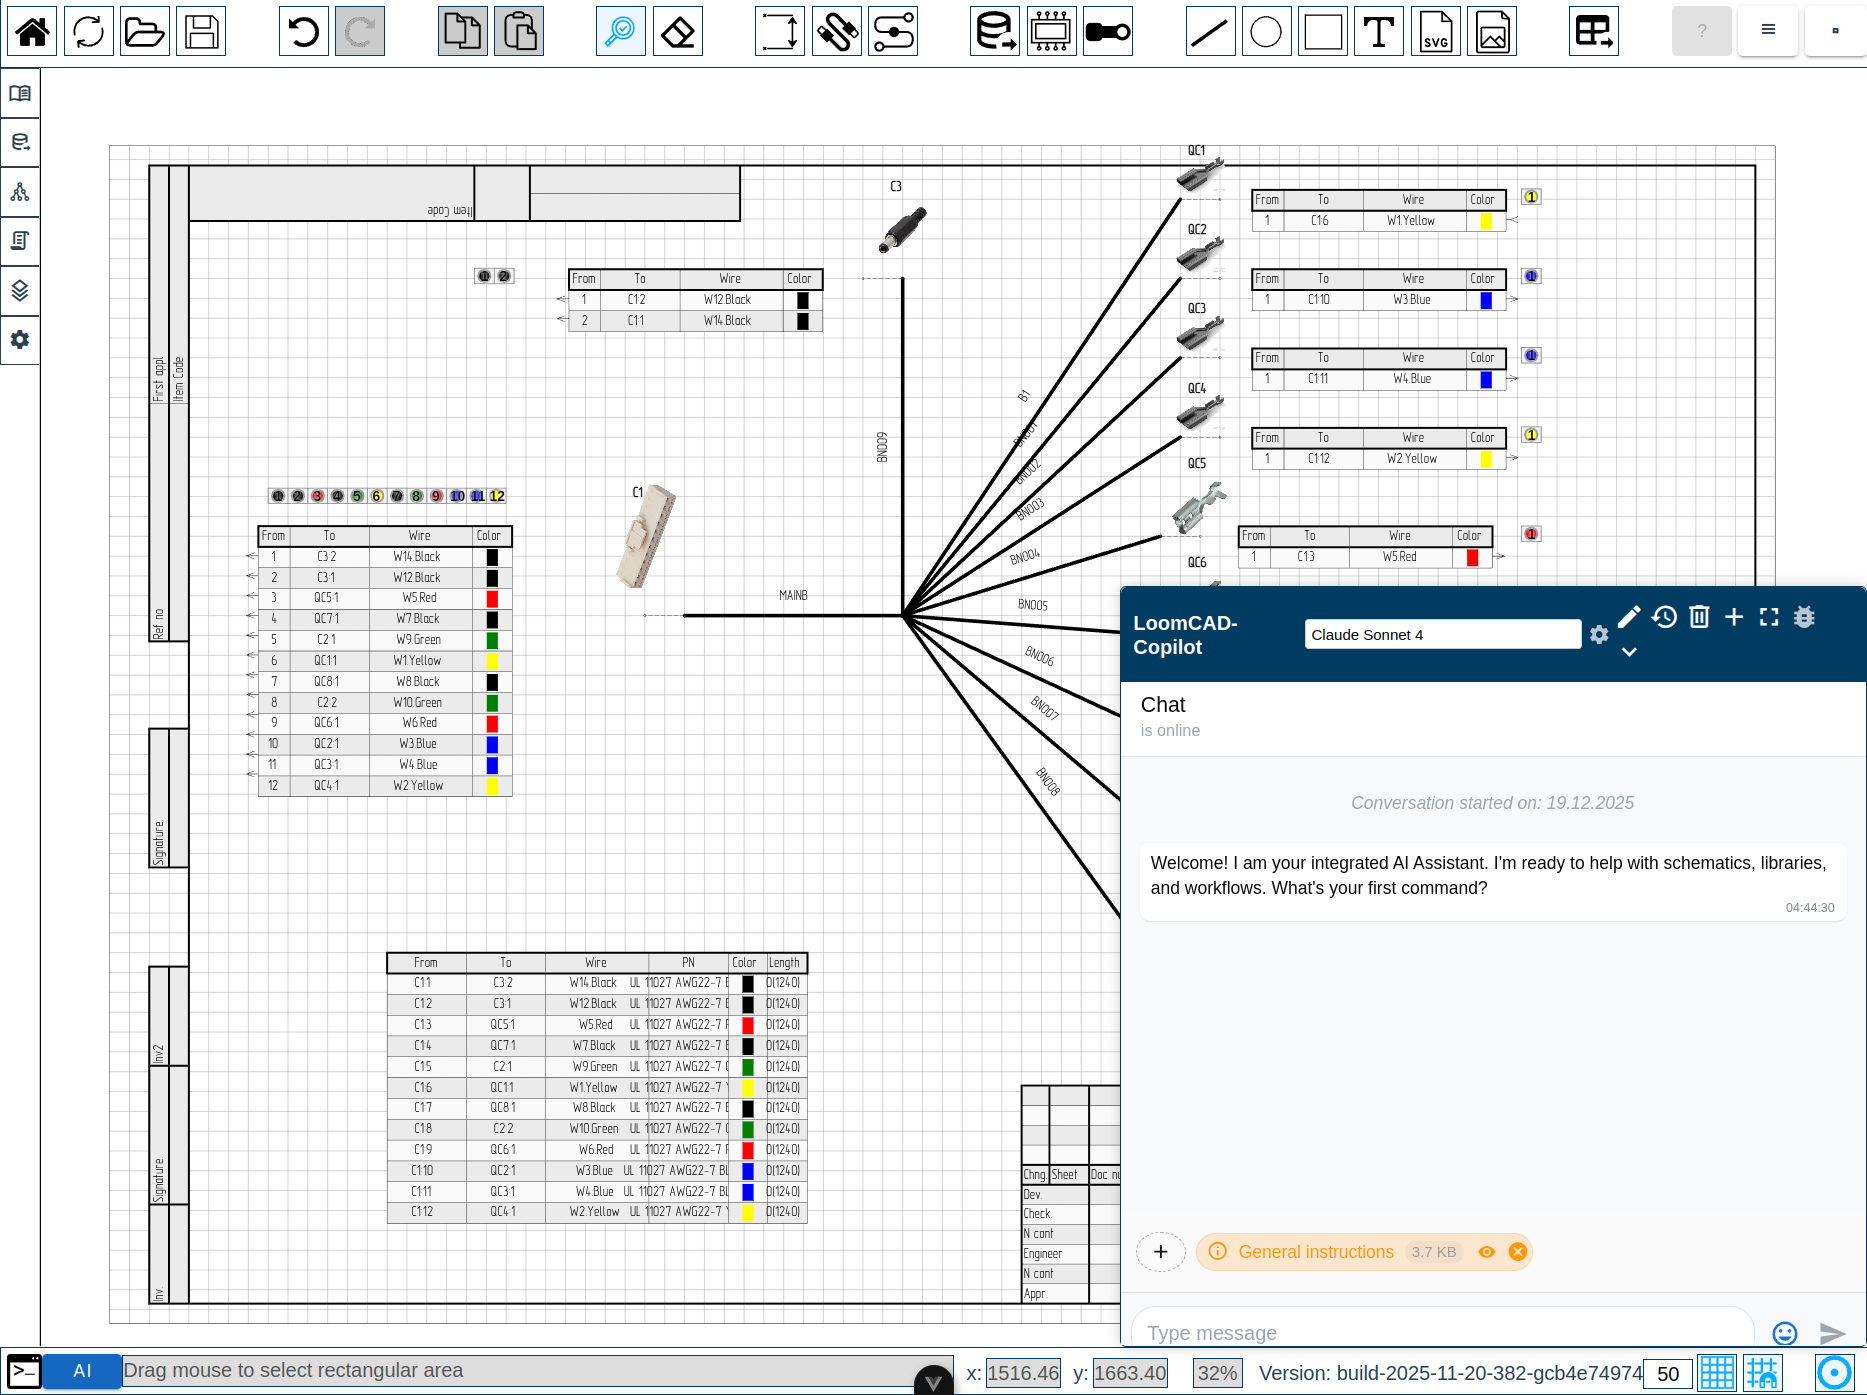
Interface Overview
LoomCAD features a modern, intuitive interface designed for efficient wire harness design. This guide introduces the main areas of the application.
 123456
Main Interface Areas
The LoomCAD interface consists of six main areas:
| # | Area | Location | Purpose |
|---|---|---|---|
| 1 | Canvas | Center | Main drawing area |
| 2 | Toolbar | Top | Toolbar with tools and actions |
| 3 | Side Menu | Left | Project, library, and settings tabs |
| 4 | Object Property Inspector | Right | Property editor for selected elements |
| 5 | Status Bar | Bottom | Status bar and view controls |
| 6 | AI Chat | Floating (bottom right by default) | AI assistant panel |
Canvas
The Canvas is the central drawing area where you create and edit your wire harness designs.
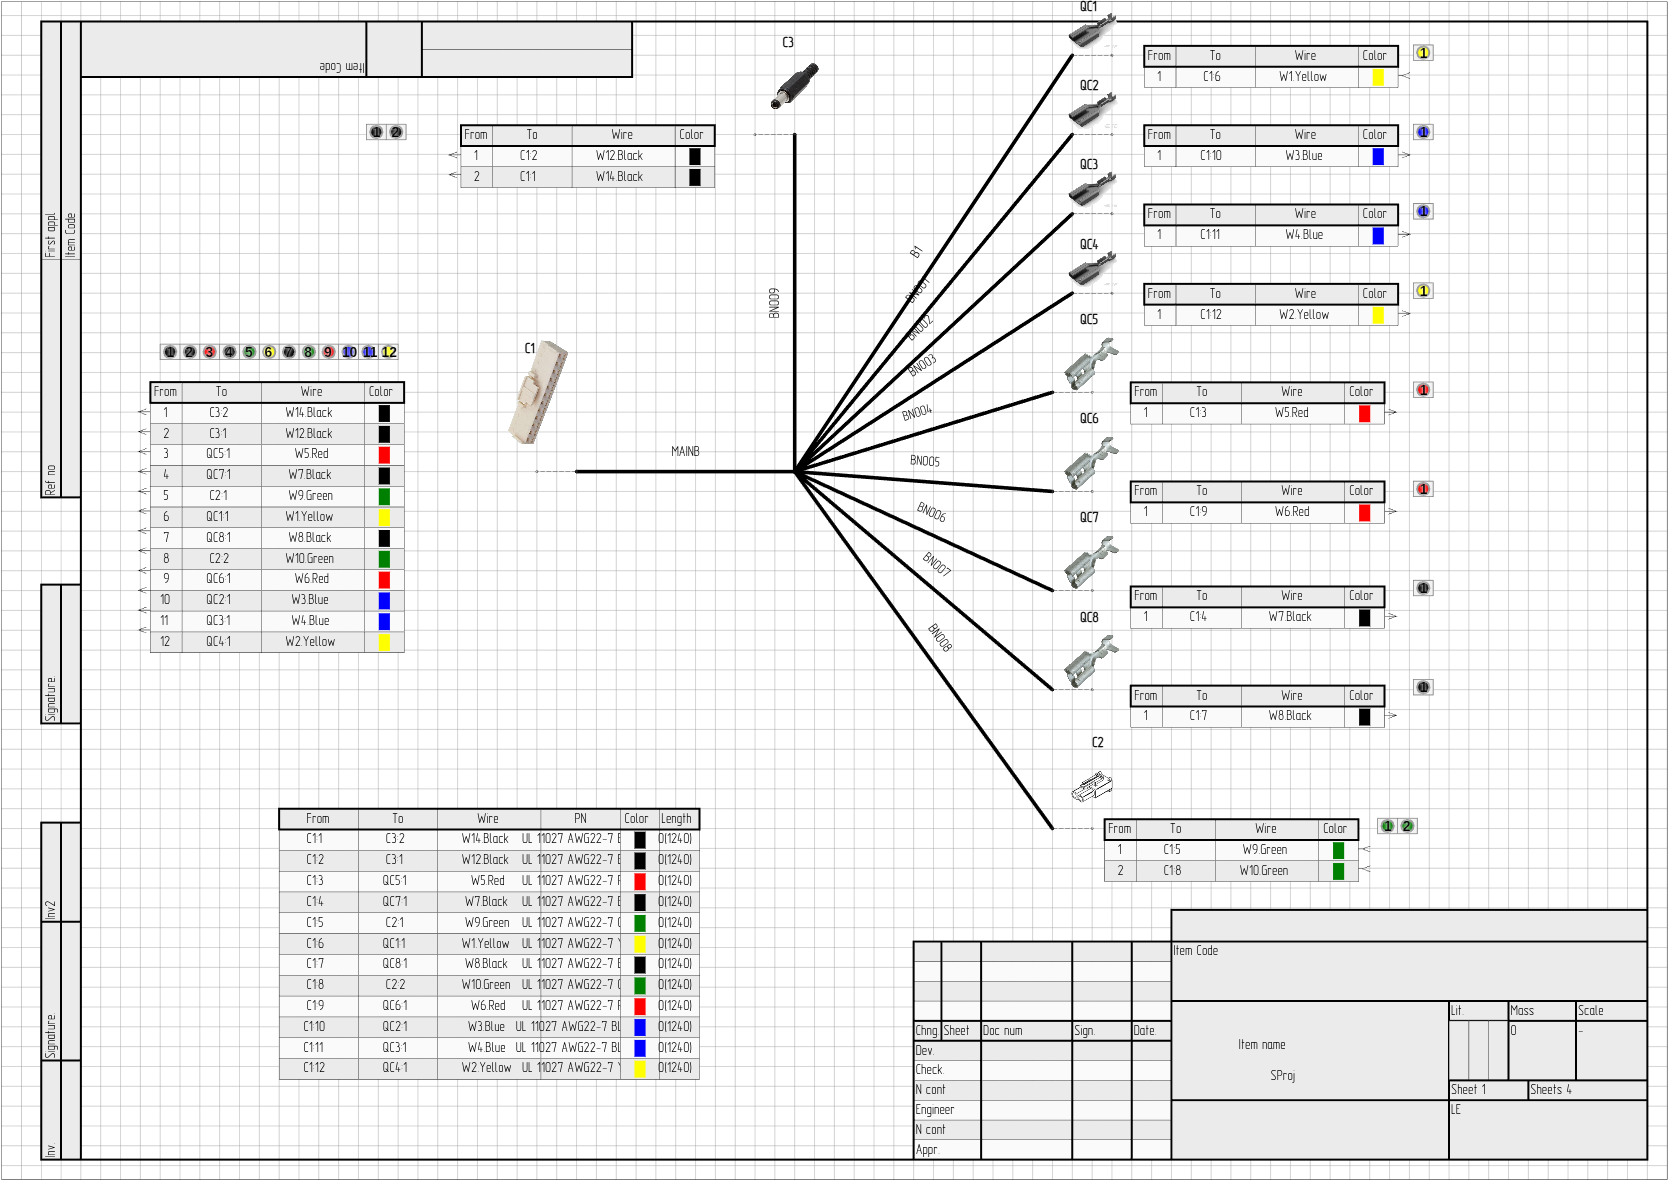
Key features:
- Multi-layer drawing system (background, grid, bundles, components, annotations)
- Infinite canvas with pan and zoom
- Grid with optional snap-to-grid alignment Quick navigation: | Action | Mouse | Keyboard | |--------|-------|----------| | Pan |
 Middle button drag | - | | Zoom | Scroll wheel | Ctrl++ / - | | Fit to view | - | Ctrl+0 |
Toolbar
The Toolbar is the top bar containing all drawing tools and actions.

Tool groups (left to right):
- Navigation: Home, Reload, Import, Export
- Edit: Undo, Redo (with history menu)
- Clipboard: Copy, Paste
- Selection: Inspection, Eraser
- Drawing: Dimension, Bundle, Wire
- Components: Library, Custom, Terminal
- Primitives: Line, Circle, Rectangle, Text, Image
- Manufacturing: View Manufacturing data
Right side:
- Help button (F1)
- Main Menu / Command Palette (Space)
- Profile dropdown
Side Menu
The Side Menu is a tabbed panel on the left side for project management and settings.
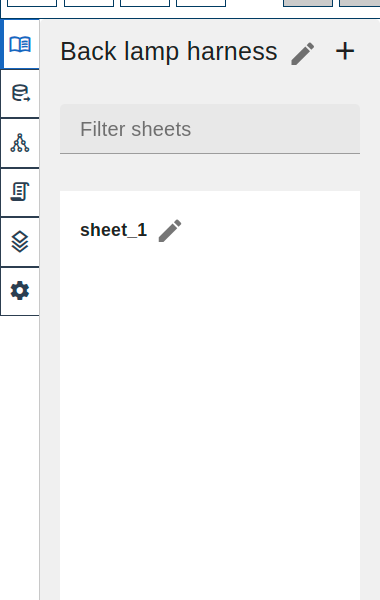
Tabs:
| Icon | Tab | Purpose |
|---|---|---|
| Sheets | Manage project sheets | |
| Library | Browse component library | |
| Objects | View object hierarchy | |
| Scripts | Manage scripts | |
| Visualization | Layer visibility, display settings | |
| Settings | Application settings |
Object Property Inspector
The Inspector panel appears on the right side when you select an element. It shows and allows editing of the selected element's properties.
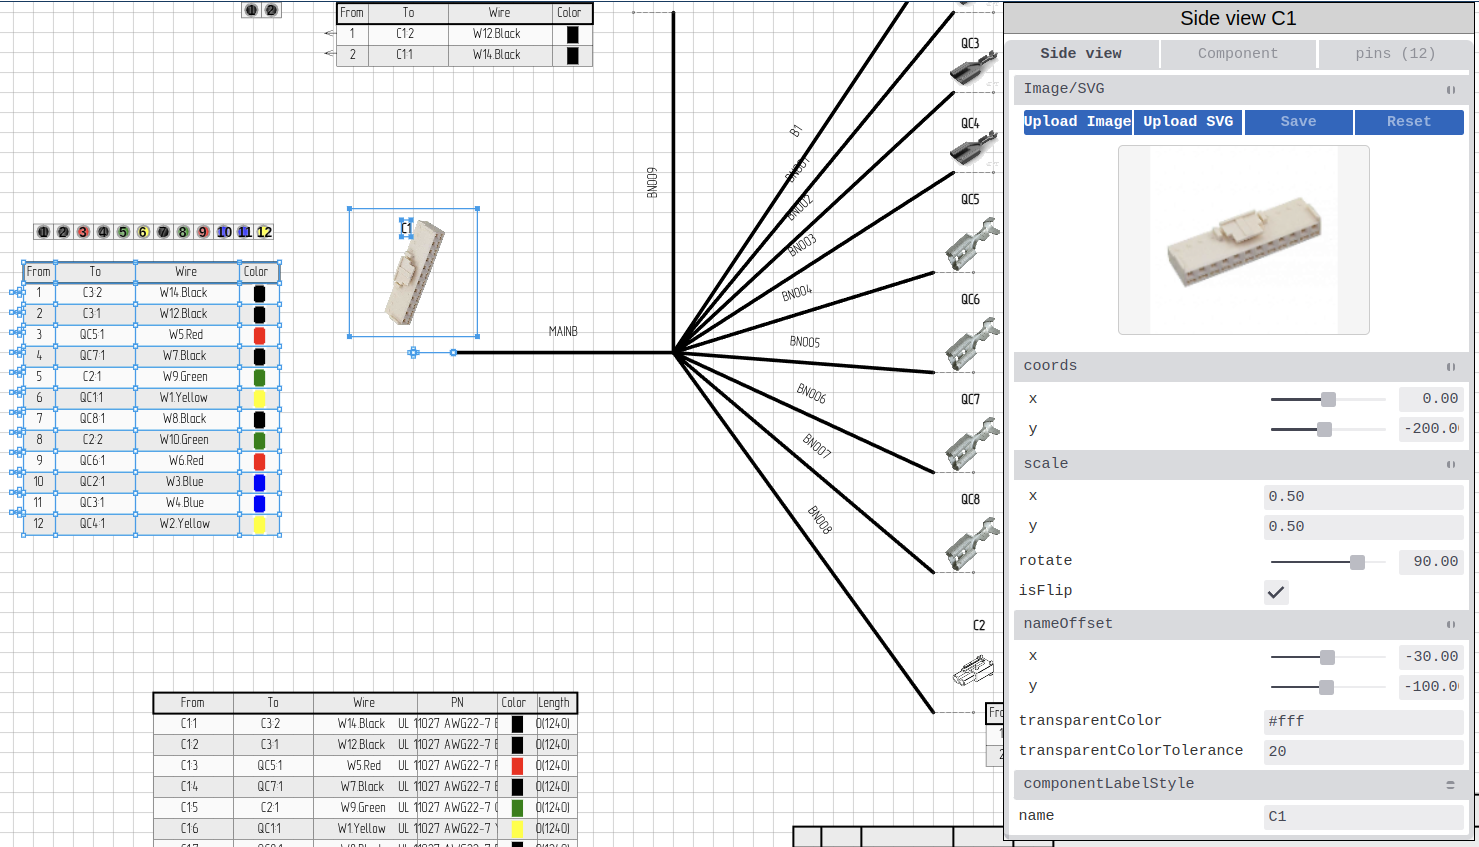
Features:
- Context-sensitive properties (different for components, wires, bundles, etc.)
- Property types: text, numbers, colors, dropdowns, JSON
- Fetch buttons to import data from DigiKey, Octopart (in development), or local library
- Pin editor for components
To open:
- Select any element on canvas with Inspection tool

- Inspector appears automatically on the right
Status Bar
The Status Bar is located at the bottom of the interface.

Elements:
- Console toggle (show/hide debug console)
- AI Chat toggle
- Status message display
- Current coordinates (X, Y)
- Zoom level (%)
- Grid size input
- Grid visibility toggle
- Snap-to-grid toggle
- Application version
AI Chat
The AI Chat panel is your intelligent design assistant powered by large language models.
Key features:
- Natural language commands ("Create connector J1 with 8 pins")
- Context awareness via badges (sees your selection, DigiKey data)
- Script generation and execution
- Multiple AI providers (Claude, Gemini, OpenRouter, local LLMs)
To open:
- Click AI button in Controls Menu, or
- Use keyboard shortcut (if configured)
Command Palette
The Command Palette provides quick access to all commands via search.
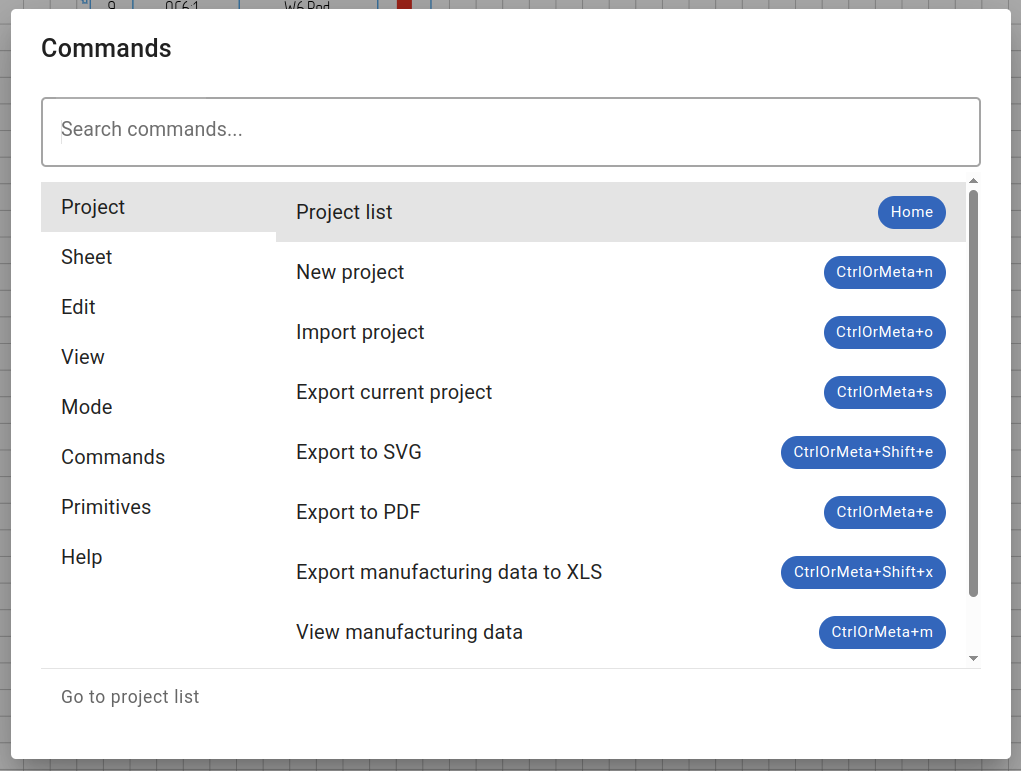
To open: Press Space or Ctrl+P
Features:
- Search commands by name
- Browse by category
- See keyboard shortcuts
- View command prerequisites
→ Learn more about Command Palette
Quick Reference
Essential Keyboard Shortcuts
| Shortcut | Action |
|---|---|
| Space | Open Command Palette |
| Escape | Select Inspection tool |
| F1 | Open Help |
| Ctrl+Z | Undo |
| Ctrl+Shift+Z | Redo |
| Ctrl+C / Ctrl+V | Copy / Paste |
| Ctrl+0 | Fit to view |
| Delete | Eraser tool |
Mouse Controls
| Action | Control |
|---|---|
| Select | |
| Pan | |
| Zoom | |
| Context menu | |
| Multi-select | Ctrl + |
Context Menus
types have different options (components, wires, bundles, anchors, etc.). See Context Menu Quick Reference for a complete list.
Next Steps
- Canvas - Learn canvas navigation and layers
- Toolbar - Explore all tools and actions
- Side Menu - Manage projects, sheets, and libraries
- Object Property Inspector - Edit element properties
- AI Chat - Use AI assistant for design tasks